While “data preparation”, “in” and “Tableau” have not been words you often see together, Tableau 9 offers some new options, building on recent data preparation advances in 8.2 with features like the data window and better visual data modeling. One of these new tools in 9 is the Data Interpreter, which is essentially an attempt to automatically clean Excel spreadsheet source data by assigning what the software judges to be good header and detail candidates. At this point, no support is offered for other text files such as CSV.
To put the Data Interpreter to the test, I used a spreadsheet containing National Institutes of Health (NIH) funding information for medical schools by department. This dataset is compiled annually from the original NIH source data by the Blue Ridge Institute for Medical Research, and the 2014 file can be found here:
http://www.brimr.org/NIH_Awards/2014/MedicalSchoolsAndTheirDepartments_2014.xls
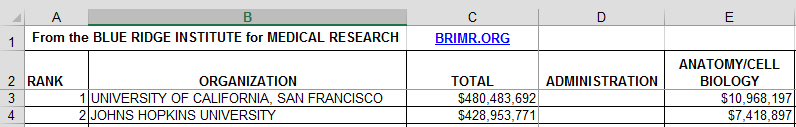
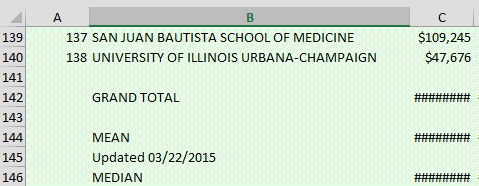
This sample data offers a good challenge for the Data Interpreter for a few reasons, and it is representative of how an ordinary Excel user may style a sheet. The header rows for the table start in the second row, while cells A1 and B1 are merged into a title. C1 contains a hyperlink to Blue Ridge’s website. In addition, the table footer contains separate rows for Grand Total, Mean and Median. Finally, a classic “Updated” date appears at the bottom between the two rows that contain averages. Other than that, it’s simply a boring, standard spreadsheet.
 Armed with this source data, I fired up Tableau 9 and enabled Data Interpreter (“cast the DI”, as it were). One of the nice things about DI is that it creates a separate, marked file explaining part of its methodology on one worksheet and the marked copy of the original data on another. This detailed file is accessible by clicking on the “Review results…” button found above Tableau’s data preview.
![]()
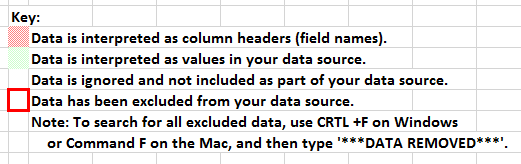 So, with no work on my part other than clicking the button, how did DI do? Poorly–at least with this scenario. For the header, the title and hyperlink in row 1 combined with the table header in row 2, and text from both was merged together into the Tableau field names. For the footer (and this is more understandable), the Grand Total, Mean, Median, and Update date were included as values at the tail instead of being excluded. As described in the figure above, red highlights indicate data interpreted as headers, and green highlights indicate values. The following figures compare DI’s marked and highlighted source data with how it subsequently appears on the Data Source window.


 Additional manual cleanup is certainly necessary before using the file in Tableau, but I had hoped that DI would perform a bit better. While most people would not rely on this feature exclusively and would likely have transformed their data prior to connecting to it with Tableau, Data Interpreter would be a good tool in a pinch, for someone without a local copy of Excel, or perhaps with simple data cleanup scenarios. Obviously, this sample dataset is only one test for DI, and I have not experimented enough yet with different sources to determine where it may work best. I will keep my eyes open and see how others may take advantage of this feature, but for the time being, the automatic classification offered by Data Interpreter does not seem to approach the level of a user’s basic judgment.