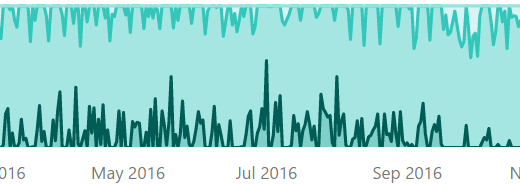
Reading Time: 5 minutes Horizon graphs are an intriguing but initially confusing way of looking at time series. Once you get familiar with the layout, you can simply think of it as a more space-efficient way of rendering a common line…
Read MoreYear: 2017
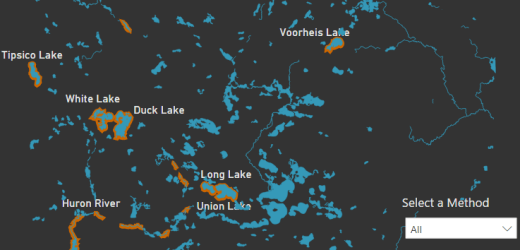
Putting the Shape Map into Focus
Reading Time: 3 minutes Here is a simple technique for the Shape Map in Power BI that allows additional focus on relevant polygons as well as adds some enhanced appeal.
Read More
A Glimpse into Michigan’s Children in Poverty
Reading Time: < 1 minute I created this report after seeing a list of local youth service organizations published by the Detroit Free Press. It features simple visualizations based on US Census data from 2015. One unique feature is a Shape Map…
Read More
Makeover Monday Week 8: Exploring the EU Potato Sector
Reading Time: < 1 minute Originally created as a Makeover Monday Week 8 submission, this Power BI report looks at the contributions for different European Union member states to potato production. Page 1 focuses on how only five countries combine…
Read More
R Tools for Visual Studio
Reading Time: < 1 minute The BlueGranite blog recently featured a post I wrote about R Tools for Visual Studio. It’s not meant to be an in-depth exploration into RTVS. Rather, at a high level, it takes a very basic look…
Read More