
If you have followed some of my recent posts, you may have noticed that I have focused a lot on the HTML Viewer custom visual for Power BI. As I have started using it, I have enjoyed the versatility that it brings to reports. Having HTML easily available without having to build a custom visual opens up a lot of possibilities.
To date, here is how I’ve showcased diverse uses for the HTML Viewer:
- How to use HTML Viewer to display data-driven images for Bookmarks on the BlueGranite blog
- Add audio or video to Power BI
- Use SVG images and icons
- Create a text adventure game
- Now, we’ll look at combining the built-in Power BI What If parameter slider with the HTML Viewer visual
In a more advanced application of this slider effect, I recently included it in my Year in Review contest entry on North Korea. The animation below displays how that particular report page functions. Rather than use text in my HTML like in this post’s example, the North Korea report had two images configured in an HTML Viewer visual that overlaid the Flow Map. One image was a static screenshot of the map, and the other was a transparent image so that you can see the original map underneath. Try it out on the Data Stories Gallery, and don’t forget to help vote for the contest entry by giving Kudos on the Community site!

How can you make a similar slider?
The key is to have one record in your data source that corresponds to a position along the slider. If you wanted a simple toggle between two positions, you would have two records with different HTML. For the North Korea map, I had 100 records corresponding to each percentage of the visual’s screen width from 1% to 100%. In this example with the Latin alphabet from A to Z, I have 26 records in my data source.
1. Create a data source with a column that contains a sequence of integers (an index or ID column).
2. Add HTML to a second column in your data source. In this sample, I used Excel formulas to quickly build HTML text with different styles based on values in other columns. Your HTML could be almost anything including text, images, CSS, audio, video, and more (some things you may attempt with <script>, <iframe>, and some other tags will not work in Power BI though).

3. Import your HTML source into Power BI.
4. Obtain the HTML Viewer custom visual from the Store/Marketplace (notice “Marketplace” in Service recently…?).
5. Add your HTML column to the HTML Viewer. Notice how all of the values appear at once in the visual.

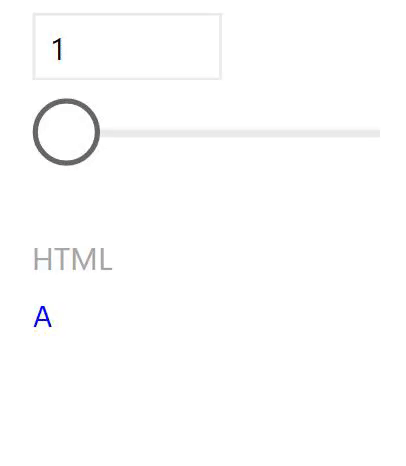
6. Add a new What If Parameter from the Modeling tab. Set the values so that they match the index column in your data source. For my Latin alphabet example, I changed the Minimum to 1 and the Maximum to 26, and I left the Increment set to 1.

7. Normally, a What If parameter is a disconnected table that does not start with a relationship to other tables. In the case of the HTML Slider, however, you create a relationship from the parameter to your index column so that the slider controls the HTML Viewer content.

The final setup for the sample looks something like this, and dragging the slider changes the value to correspond to the appropriate data record! Let me know if you would like the sample Excel and PBIX files for this post by leaving a comment below.
Very Pretty!
It’s possibile to have the example , please?