
While R has been available in Power BI for a few years, Python was recently added as preview functionality to Power BI Desktop. If you have done any work with Power BI’s R Script or Python Script in Power Query, you may have noticed that many scripts appear to run slower in Power BI than if you ran them standalone in R or Python. In order to minimize performance problems and optimize your code, it’s helpful to understand a bit about the process of how Power BI runs R and Python scripts–especially relating to local disk input/output.


The basic implementation is similar enough for R and Python where they can be discussed together:
- Power BI’s Power Query runs either the R.Execute() or Python.Execute() function. Both of these Power Query functions rely on ADO.NET providers to access R and Python.
- Power BI creates a temporary folder within the R or Python working directory starting with RScriptWrapper or PythonScriptWrapper and ending in a GUID. Depending on how you use R or Python in your queries, you may see several of these created in the course of a refresh if you watch the working directory.
- Power BI writes temporary files to the temporary folders. These files consist of CSV export(s) of input and intermediate datasets, and RScriptWrapper.R or PythonScriptWrapper.PY, which contains your custom code.
- The R or Python script generates output, and the final CSV output (or an image if you are using the R or Python Visual) is saved to the wrapper folder.
- Power BI reads the output.
- Power BI deletes the RScriptWrapper or PythonScriptWrapper contents and folder when no longer needed.
This reliance on local IO and ADO.NET providers leads to a few considerations for the “Python Script” or “R Script” in Power Query. Keeping the following tips in mind could help the performance of your scripts.
In addition to the steps below, watch this video that I recorded on this topic for BlueGranite. While you’re watching, be sure to hit SUBSCRIBE to get more content from the BlueGranite YouTube channel! https://www.youtube.com/c/BlueGraniteInc
1) Only import packages you use
There is overhead associated with using packages, so only import what you will need from various libraries for a given script. Also, if you only need part of a module, try not to load the entire library, e.g. use from sklearn import […] instead of import sklearn.
For Python, there is no need to explicitly important pandas in Power BI. It’s common to see import pandas as pd in a Python script, but it’s redundant because Power BI imports it every time without the alias. Any places you would normally use pd for pandas, use the full library name instead, e.g. pandas.DataFrame instead of pd.DataFrame.
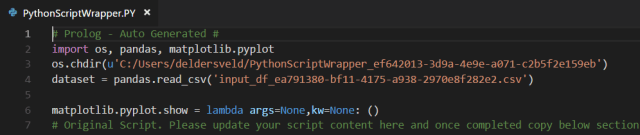
You can see this by examining the auto-generated prolog in the PythonScriptWrapper.py. os, pandas, and (even though this is for the Python Script and not Python Visual) matplotlib.pyplot are available to every Python script.
By the way, if you are trying to decide whether to use Python 2 or 3 in Power BI, pandas will be exclusively releasing updates for Python 3 starting January 1, 2019 and ending support for Python 2 completely on January 1, 2020.
Examining the corresponding prolog for R scripts in RScriptWrapper.R, you can see that Power BI does not load any libraries by default.

2) Streamline input data
Both the R Script and Python Script create temporary RScriptWrapper and PythonScriptWrapper folders within their corresponding working directories. If you examine the prologs from #1 above, you will see that Power BI saves the current initial dataset to a CSV named input_df, which is then read into R or Python.
If possible, run R and Python scripts after filtering raw data and removing any unnecessary columns. This would help reduce the size of the input_df CSV written to disk before it is then read into R/Python.

3) Don’t use intermediate Data Frames in your script
If you store changes as new data frames in your script, you will get local CSV copies of every data frame in addition to the original input data. While it is not a useful example, you can see that CSV files a.csv and b.csv appear in the temporary PythonScriptWrapper directory after running sample code a = dataset.copy() and b = a.
Note as well that I did not have to explicitly import pandas per #1 above to use .copy() –– it’s already available.


For the same reason, avoid writing any intermediate output to disk in your script unless you would actually use it for something.
4) Use one R or Python script per query
Consolidate custom code into a single R or Python query. Rather than use “Run R script” or “Run Python script” numerous times in the same Power Query query, use a single script to perform multiple tasks on the same data frame. This will also save on local IO to the R or Python working directory and should help your Power Query query run faster.
5) Don’t use R or Python if native Power Query will do
Considering all of the above, if you are targeting performance, it is best to use Power Query’s built-in transformations wherever possible. If you can accomplish steps related to data cleansing or feature engineering natively in Power Query’s user interface or custom M code, choose the native transformation. Save R or Python for more advanced modeling and other outcomes exclusively available to those languages.
Python in Power BI Webinar on December 6th
Finally, if you are interested in learning more about the possibilities for using Python in Power BI, BlueGranite will be hosting a free webinar on December 6th. Please register on the BlueGranite page to attend!
https://www.blue-granite.com/python-in-power-bi-webinar-dec-2018
Thank you for this helpful post!
Do you know if I can use DAX studio or some other tool to measure/optimize my R/Python scripts’ performance in Power BI?
I’m not aware of another tool to help optimize R or Python performance