
One of the conveniences of Tableau is the ability to easily create “running” totals or other aggregations. These table calculations can be handled through the user interface. One of the questions that I sometimes receive from Tableau users learning Power BI is how to create the equivalent of a Running Sum. As with most things in Power BI, there are alternate methods, but I’ll share a point-and-click way using Quick Measures. As people grow more confident with the DAX language in Power BI, they may attempt different forms of measures. For Power BI beginners, however, Quick Measures provide a good way to approximate the Tableau Running_[SUM/AVG/MIN/MAX/COUNT] workflow.
Initial Setup
For consistency between my Tableau and Power BI examples, I used Tableau’s superstore sample data:
http://www.tableau.com/sites/default/files/training/global_superstore.zip
Once you have the data loaded, the initial setup explores Sales by Region over a series of Order Dates. This is intentional and is meant to align somewhat with the setup in Tableau’s table calc documentation. If you reference that, note that the years and measure differ between the documentation and the screenshots here while maintaining Order Date on Rows and Region on Columns.
Here is my initial Tableau setup:

Here is my initial Power BI setup with the Matrix visual:

With Power BI, after adding Order Date to Rows (with the default automatic date hierarchy enabled), you will see the following view initially. If you are newer to Power BI and cannot get the view showing Year and Quarter, hover over the icons surrounding the view until you see the one labeled Expand all down one level in the hierarchy. Click it to display Year and Quarter at the same time.

What about a separate Power BI Date table?
This setup is built for consistency of comparison. As people go deeper into Power BI, they typically add a separate Date table as part of a more robust data model and add relationships between tables. At the same time, they disable the default Auto Date/Time built-in hierarchies. This more advanced setup with a separate Date table allows several conveniences as well as performance and storage benefits. It’s especially true with larger models that include many fact tables that each join to Date and other possible dimension tables. Tableau doesn’t currently have a comparable data model. We’ll stay conveniently away from that setup in Power BI because we only have one simple sample table.
Running Total (Sum) in Tableau
Skip ahead if you’re only interested in learning Power BI’s approach. For the benefit or review of everyone though, let’s take a look at two methods to calculate the Running Total in Tableau.
The first is point and click, where we can click on the arrow on SUM(Sales) under Marks and select either Add Table Calculation or Quick Table Calculation. The quick table calc would default to calculating across the table. I want to calculate down, so I select Add Table Calculation.
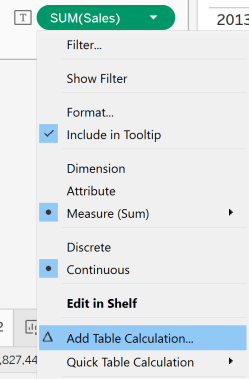
Select Running Total, Sum, and Table (down). Tableau conveniently displays a preview of the calculation on the sheet behind the open window as you change options.

An alternate method is to create a new Calculated Field using the RUNNING_SUM function. This calculation persists under Measures and can be reused easily across sheets.
The calculation in this case is:
RUNNING_SUM(SUM([Sales]))

While the calculation defaults to evaluating as Table(Across), you can override that on the sheet to evaluate as Table(Down) or another way as needed.

Running Total in Power BI
Power BI has a point-and-click method for creating frequently required measures called Quick Measures. In addition, you could also manually create a measure with DAX code akin to creating a Tableau calculated field. Whether you start with a Quick Measure or code your own DAX measure from scratch, there is no concept of Table/Pane/Cell or Across/Down like there is in Tableau. You need to know which dimension field you will use with the Running Total measure and add it directly into the measure. The technique is similar to choosing a Specific Dimension when you create a table calculation through the UI in Tableau.
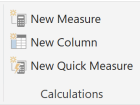
To create a Quick Measure, select New Quick Measure from the Home tab on the ribbon at the top. Alternatively, you can hover over a numeric field in the Fields pane, click on the […] that appears, and select New Quick Measure there. An advantage of the latter method is that Power BI already fills in the Base Value based on the field that you started with.
After selecting New Quick Measure, a new window appears. Select Running total from the Calculation menu.

Click and drag Sales to Base value and then click and drag Order Date to Field. Note that the base value defaults to Sum of Sales. When ready, click OK.

A new measure should appear in Power BI’s Fields pane called Sales running total in Order Date.
Sales running total in Order Date =
CALCULATE(
    SUM('Global Superstore'[Sales]),
    FILTER(
        ALLSELECTED('Global Superstore'[Order Date]),
        ISONORAFTER('Global Superstore'[Order Date], MAX('Global Superstore'[Order Date]), DESC)
    )
)
By default, adding this measure as-is to the matrix visual will not display the running sum as you would expect. There’s a small modification that allows it to work with the built-in date hierarchy on Order Date. Add .[Date] or .[Day] to the end of ‘Global Superstore'[Order Date] as in the calculation below. This change allows the running total to work across all levels of the automatic Order Date hierarchy. It’s not required within the MAX() function, but it would not change the calculation if you appended it there either.
Sales running total in Order Date =
CALCULATE(
    SUM('Global Superstore'[Sales]),
    FILTER(
        ALLSELECTED('Global Superstore'[Order Date].[Date]),
        ISONORAFTER('Global Superstore'[Order Date].[Date], MAX('Global Superstore'[Order Date]), DESC)
    )
)
If that process of getting the measure to work with the Order Date hierarchy seems too manual or inconvenient, it’s because I didn’t show you the shortcut. It’s a common mistake to simply add the field, so it’s helpful to know how to recover without having to start from scratch. As a shortcut though when creating your Quick Measure with an automatic date hierarchy like with Order Date, you could have clicked the arrow after adding Order Date to Field, then selected Day from the menu.

Add the measure to Values in the matrix visual. After removing the original Sales measure from Values, Power BI now displays the new running total measure in the matrix.

Restarting a Running Total
What if we want to restart the running total every year, for example? You could add the following line in bold below (or a similar construct if you know some DAX) to the existing running total measure. There’s currently no way to achieve this in the Quick Measure setup itself, so it requires some manual coding.
Sales running total in Order Date =
CALCULATE(
    SUM('Global Superstore'[Sales]),
    FILTER(
        ALLSELECTED('Global Superstore'[Order Date].[Date]),
        ISONORAFTER('Global Superstore'[Order Date].[Date], MAX('Global Superstore'[Order Date]), DESC)
            && YEAR('Global Superstore'[Order Date].[Date]) = MAX('Global Superstore'[Order Date].[Year])
    )
)
The column to the right shows the resulting restart at the beginning of the next year.

Other Running Functions
In addition to RUNNING_SUM, Tableau has other table “running” table calculations. These involve a similar setup to the RUNNING_SUM outlined earlier.
- RUNNING_AVG
- RUNNING_COUNT
- RUNNING_MAX
- RUNNING_MIN
Creating these different running aggregations in Power BI involves a small variation to either your Quick Measure setup or a DAX measure that you code from scratch.
For Quick Measures, simply click the arrow after adding the Base value. Change the aggregation from the default of Sum to one of the alternatives.

When you directly code a measure or modify an existing one, simply replace the SUM() function with the appropriate DAX aggregation function. Power BI’s equivalent functions are AVERAGE, COUNT, MIN, MAX. Power BI also has a few other options like MEDIAN that don’t have RUNNING_ equivalents in Tableau. Here’s an example with AVERAGE():

A common measure that find useful for running totals in Tableau.