
One of the defining features of Power BI’s [paginated] Report Builder vs the current geospatial offerings in Power BI Desktop is the native support for ESRI Shapefiles. If you have worked with maps in Report Builder over the years, you may have used the Map Gallery. The Map Gallery offers a collection of built-in geographies, but you can also customize and enhance what’s available out of the box.
Note the custom folder and map option in the screenshot below. Why would you want to add maps to the gallery, and what does it take to add them?

Why Customize the Map Gallery?
Maps in the Map Gallery are simply Shapefiles that have been added to a report, saved in the .RDL file format, and dropped in the default installation folder (e.g. C:\Program Files (x86)\Power BI Report Builder\MapGallery). If you can browse out to existing Shapefiles, however, what’s the benefit of enhancing the Gallery?
In my case, it saves a few steps by enabling dependable reuse and leaves common custom maps all in one place. You don’t need to hunt by browsing. If you need to upgrade or ever remove/re-install Report Builder, the custom maps are not removed during the installation/uninstallation process. They’ll remain for every version.
For organizations that have numerous developers building reports, adding to the Map Gallery could also provide consistency across the organization. Maps in .RDL format can be automatically deployed along with the Power BI Report Builder installation if desired. For example, if I obtain Report Builder from an organizational software catalog somewhere, whoever configures that could potentially add a process to automatically distribute map files too.
How to Customize the Report Builder Map Gallery
It only takes a few simple steps to start customizing your Gallery to enable easier reuse of custom maps.
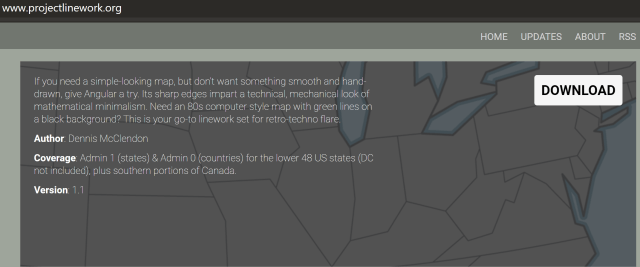
- Find a Shapefile you want to use. In this case, I’ll use the public domain Angular sample from Project Linework, download it, and extract the zip to get the .shp and other files associated with it.
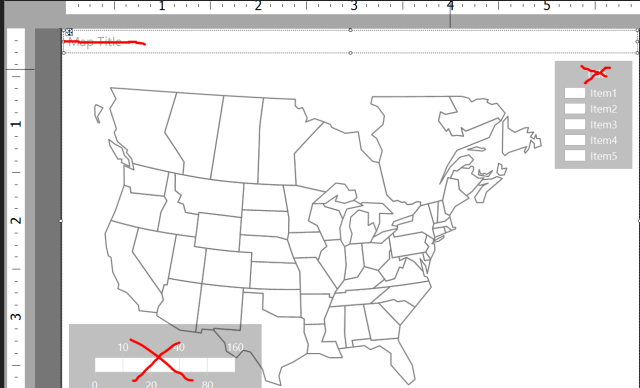
- Start Report Builder with a new report, and then remove the title and page footer to have a “clean” report.
- Go to the Insert tab and select Maps and then Map Wizard.

- Select the ESRI Shapefile option and browse for the Shapefile (.shp). Click Next when ready.

- Continue through the wizard by optionally cropping the map, clicking Next, selecting the Basic Map option, clicking Next, choosing the Single Color option, and clicking Finish.
- Once the Shapefile appears in the map on the report canvas, remove the Map Title, Legend, and Color Scale.
- Save the report (.RDL file).
- Close Report Builder, then browse to the Map Gallery folder (default = C:\Program Files (x86)\Power BI Report Builder\MapGallery).
- Add a new folder for a custom map collection.

- Drop the RDL into that folder.

- Open Power BI Report Builder again, start the Map Wizard, and look for the custom map in the Map Gallery!
Thank youDavid for your answer!…I have in my PC Power BI-Pro, but I dont have the map gallery, what version I need?
I have another question. there is an option for to realize searchs, but this has the name “search” (text filter). Can you tell me other options for to do searchs! in spanish.
I live in Spain, and the dashborard are for ours clients, and they speak spanish.
Thank you Janneth. The Map Gallery is only available in Report Builder for paginated reports, not in Desktop for standard PBIX reports.
For text search, in addition to the Search on the dashboard option, the the Text Filter custom visual that you reference is the main way that I know to search the dataset: https://appsource.microsoft.com/en-us/product/power-bi-visuals/WA104381309