
Along with an updated Power BI Desktop ribbon, several additional report themes are now available. The Power BI docs provide a great reference to the new options, except they do not include the specific color values for anyone who wants that level of detail.
Last year, I compiled a hex color reference for the (then eight) built-in themes. Power BI now has a lot more themes from which to choose in addition to easily building your own. It’s time for an update.
The following embedded report shows all theme colors with their sequence. If you want to copy a hex value, right-click on it, then choose Copy and Copy Value.
With the earlier updates to my color reference, I had to painstakingly obtain the colors manually. To do this, I used a tool called Instant Eyedropper. It sits in the system tray, and with a simple click, I get any onscreen color value. My former colleague Jason Thomas recommended this small app to me years ago when he worked for BlueGranite. It’s free and easy to use, and I rely on it a lot.
But I no longer need to obtain Power BI Theme colors manually… WHAT???
The December Power BI Desktop update allows users to export theme files. This is currently a Preview Feature that needs to be enabled in Options and Settings. You are not limited to exporting themes that you define. You can also export the JSON for built-in themes (except Default and Classic). In the Theme area in the View tab, there is a new Export Current Theme option.

With this capability, I exported all the theme files. Those files have the detail on the hex colors and sequence for each theme. Did I then simply open up and grab the hex colors manually? No!
Since Power BI reads JSON, I used the Folder data source and pointed it to the folder where all my theme files resided.

After some transformation, the JSON objects from the file appeared in the Name column. The values that I was after were under dataColors, which appear as a List.

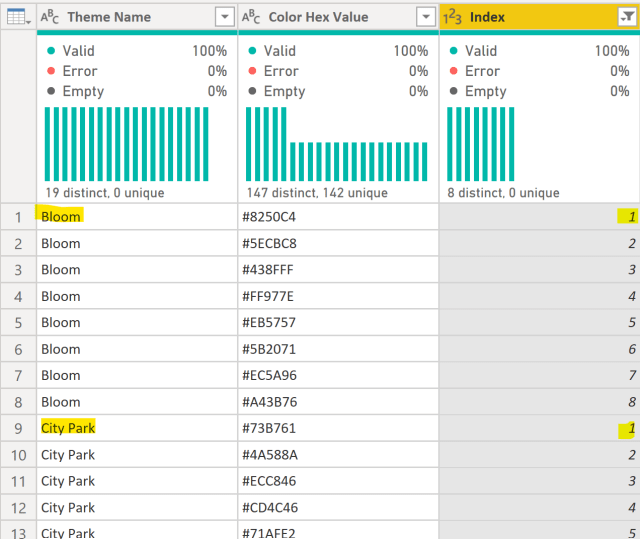
I couldn’t simply filter down to dataColors and then expand the list to a table of records though. A key part of this effort is to preserve the color sequence. Expanding the list and then loading the data as-is would not allow me to sort properly, so I needed an index along with the color values. Power BI has the ability to add an index easily for all records in a table, but I needed the index to reset for every theme. Here is where some valuable work from Ken Puls came in with his guidance to number rows by group. Note in the following screenshot how the Index resets with the next theme once the values are expanded.
From here, I only needed to do some filtering and basic cleanup. Each theme contains 32 colors with only the first eight visibly represented in Power BI. For my reference, I filtered down to eight as well.
With the resulting table of data, I dropped the colors into a Matrix visual and added two sets of conditional formatting:
- Background Color is the obvious one with the color set to the field value.
- Font Color is also conditionally formatted. If you look at some of the matrix text, you’ll notice that some fonts are black while most are white. In this case, Daniil Maslyuk provided the measure necessary to dynamically select the font color based on the background color. This provides contrast so that the font and background do not blend too much.
Thanks to both Ken and Daniil for their indirect contributions to this now-data-driven effort. I hope that some people continue to find this level of detail useful.
Here is a static image to save if needed.

As of Feb 2023 There are now new “Accessible” themes. You can see a quick example in this youtube: https://youtu.be/Rac1EiR5cH4?t=596