
The Power BI Gen2 capacity model significantly changed the way that Power BI resources are shared among multiple or reserved for individual customers. Attempting to draw a good analogy of how capacities work, however, leads to significant oversimplification.
Simple analogies typically tackle how to build capacity of a certain size, but these often stop short of attempting to explain concepts geared toward the impact of utilization: concepts such as CPU time / capacity units, interactive versus background operations, CPU smoothing, and autoscale.
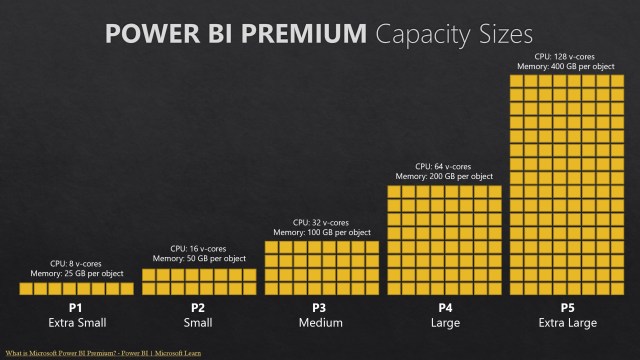
For simplicity, we still use analogies like blocks where you can buy and deploy what you purchased (buy a P2, deploy a P2), or you can build a combination of capacities from different tiers (buy a P2 and deploy 2 P1s, buy 4 P1s and deploy a P3, etc.). With simpler analogies like blocks, the resources are there, but little explanation is provided for how resources are used.
An important impact of the change to Power BI Gen2 architecture is more flexibility when compared to Gen1. A capacity unit like CPU time measures throughput–it’s flow rate over time.
I Love Lucy Analogy
A simple analogy that goes further to illustrate the impact of throughput might be the famous candy wrapping sketch from the television show I Love Lucy. It’s a fun one but still not close to detailed accuracy. You get X amount of time to wrap Y amount of chocolates, and if you don’t wrap it all, the opportunity is gone.
With capacity, you use it or lose it based on operations taking place across windows of time (24 hours for aggregate background operations and minutes for interactive operations). You can’t abstain from usage for most of a month and then consume all your capacity on the last day. Instead, you consume what’s allowed in a window of time, or else you need autoscale to temporarily lease more CPU (and autoscale is CPU only, not additional memory).
Complicating matters though is that there is also specialization among different workloads, and distinct types of highly variable utilization aggregate to a measure of capacity utilization. Differentiation is also built into the structure of the underlying capacity resources.
Quoting sections in full from Power BI Premium Gen2 architecture – Power BI | Microsoft Learn:
The most significant update in the architecture of Premium Gen2 is the way capacities’ v-cores are implemented:
In the original version of Power BI Premium, v-cores were reserved physical computing nodes in the cloud, with differences in the number of v-cores and the amount of onboard memory according to the customer’s licensing SKU. Customer administrators were required to keep track of how busy these nodes were, using the Premium metrics app. They had to use the app and other tools to determine how much capacity their users required to meet their computing needs.
In Premium Gen2, v-cores are implemented on regional clusters of physical nodes in the cloud, which are shared by all tenants using Premium capacities in that Power BI region. The regional cluster is further divided into specialized groups of nodes, where each group handles a different Power BI workload (datasets, dataflows, or paginated reports). These specialized groups of nodes help avoid resource contention between fundamentally different workloads running on the same node.
Note
Power BI Gen2 provides logical segregation of data between different customers, and is compliant with ISO 27017. For more details see ISO/IEC 27017:2015.
Insect Colony Analogy
With aspects of function and underlying structure, perhaps another analogy might be an ant colony or a beehive. These insects have clear job roles built into the structure of their organization including a queen, drones, and workers–similar to how capacity is allocated among operations like datasets, dataflows, paginated reports, etc.
Ants and bees also capture the idea of work over time. If a colony can’t work as effectively or at all one day, perhaps due to rain or some other environmental factor, they can’t work double time the next day to make up for the capacity window that was underutilized. It’s lost to time.

Where analogies of ants or bees fall short, however, are in the distinction between background and interactive operations as well as how autoscale is handled. Bees don’t reach maximum capacity in their hive and borrow neighboring bees for a day from another hive.
Agriculture Analogy
Another possible analogy that tries (still imperfectly) to account for aspects like background versus interactive operations and autoscale might be an agricultural one.

In the agricultural analogy, consider water usage:
- You run a farm consisting of many fields and animals.
- A river passes through your farmland (capacity).
- A dam (Microsoft) upstream controls the flow rate of the river (capacity units). You lease a certain amount of water.
- You’re able to draw water from the river through a series of pumps and pipelines to irrigate your fields (background operations). This water usage is more consistent and predictable–perhaps once a day or a few times per day. Water drawn for this type of irrigation also reduces the flow rate for other uses.
- You water your livestock (interactive operations), some of which may be large cows or sheep while others may be small chickens. This water usage is less predictable since you water the animals throughout the day, but different animals of different sizes may also drink on their own upstream of where you draw their water.
- If you don’t use any water for a period of time, it’s gone downstream and unrecoverable.
- If the river runs dry based on your use during a particular period of time, you have the option of requesting more for the short term (autoscale) or long term (increasing capacity size). Microsoft then opens the floodgates to allow more water to flow downstream.
What Else?
While no analogy is perfect, can you think of any other way to describe Power BI capacity that capture more of the nuance? Please share your ideas!