
Creating Slopegraphs in Power BI
Reading Time: < 1 minute Did you know that it’s easy to transform Power BI’s Line Chart into a Slopegraph? No DAX or fancy workarounds are required. Slopegraphs are a great way to judge the rate and magnitude of change by…
Read More
Throwing a Curve at the Power BI Line Chart
Reading Time: 6 minutes Last month, I explored how to take a Power BI area chart and make it into a unique “new” chart type using only data and DAX formulas. The line chart is also a candidate for a…
Read More
Is Power BI “Free” the same as a Personal version?
Reading Time: 2 minutes In a recent blog post, Matt Allington offered some good commentary on the new Power BI license changes. There’s a lot of content to go through in his post, so check it out. One thing in…
Read More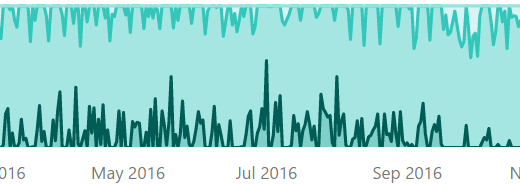
Building Horizon Graphs in Power BI
Reading Time: 5 minutes Horizon graphs are an intriguing but initially confusing way of looking at time series. Once you get familiar with the layout, you can simply think of it as a more space-efficient way of rendering a common line…
Read More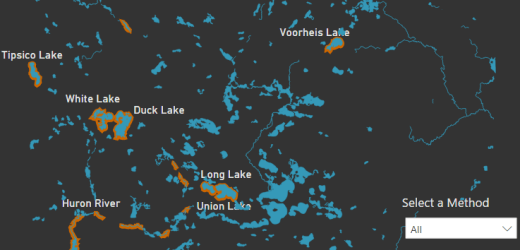
Putting the Shape Map into Focus
Reading Time: 3 minutes Here is a simple technique for the Shape Map in Power BI that allows additional focus on relevant polygons as well as adds some enhanced appeal.
Read More