
Reading Time: 6 minutes Last month, I explored how to take a Power BI area chart and make it into a unique “new” chart type using only data and DAX formulas. The line chart is also a candidate for a…
Read MoreCategory: Tutorial
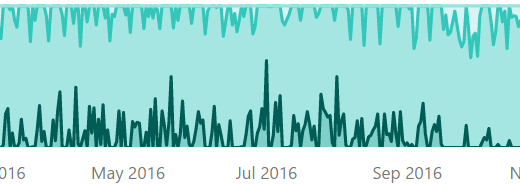
Building Horizon Graphs in Power BI
Reading Time: 5 minutes Horizon graphs are an intriguing but initially confusing way of looking at time series. Once you get familiar with the layout, you can simply think of it as a more space-efficient way of rendering a common line…
Read More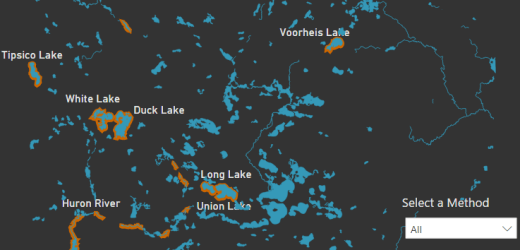
Putting the Shape Map into Focus
Reading Time: 3 minutes Here is a simple technique for the Shape Map in Power BI that allows additional focus on relevant polygons as well as adds some enhanced appeal.
Read More
How To Add Your Own ArcGIS Reference Layers for Power BI
Reading Time: 4 minutes One of the nice features of the ArcGIS visual is that you can add a reference layer that sits on top of your basemap but below your data. The ability to search means that you can…
Read More
Overcoming Potential Power BI Shape Map Rendering Issues
Reading Time: 4 minutes In Kasper de Jonge’s great blog post “Use any map with Power BI”, he recommends a convenient tool called mapshaper. Mapshaper is a free web application created by Matthew Bloch that works with a variety of different geographic file formats…
Read More