
Reading Time: < 1 minute Did you know that it’s easy to transform Power BI’s Line Chart into a Slopegraph? No DAX or fancy workarounds are required. Slopegraphs are a great way to judge the rate and magnitude of change by…
Read MoreTag: Data Visualization

Throwing a Curve at the Power BI Line Chart
Reading Time: 6 minutes Last month, I explored how to take a Power BI area chart and make it into a unique “new” chart type using only data and DAX formulas. The line chart is also a candidate for a…
Read More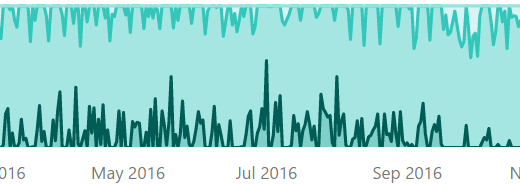
Building Horizon Graphs in Power BI
Reading Time: 5 minutes Horizon graphs are an intriguing but initially confusing way of looking at time series. Once you get familiar with the layout, you can simply think of it as a more space-efficient way of rendering a common line…
Read More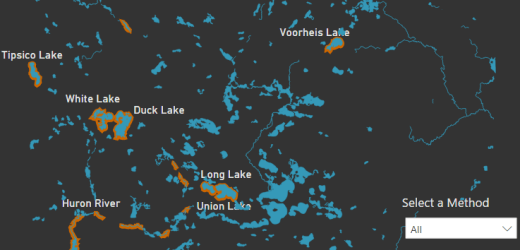
Putting the Shape Map into Focus
Reading Time: 3 minutes Here is a simple technique for the Shape Map in Power BI that allows additional focus on relevant polygons as well as adds some enhanced appeal.
Read More
Power BI with ArcGIS Maps on the BlueGranite Blog
Reading Time: < 1 minute Over time, this personal blog (somehow) became a Power BI mapping blog. As a result, it would seem odd to not address the newly announced Esri collaboration and ArcGIS Maps for Power BI here. My thoughts on…
Read More