
Reading Time: 3 minutes Every once in awhile, I encounter questions from a trainee or client who is familiar with Tableau but who is getting started with Power BI. They have the ability to do X in Tableau and want…
Read MoreTag: DAX

Unpivoting Sensitive Columns in Power BI to Apply Row-Level Security
Reading Time: 3 minutes In my last post, I explored a less-than-ideal way to approach the lack of object-level security in Power BI. That workaround used DAX to mask sensitive values for certain users. Since that method is not a…
Read More
Masking Measure Values in Analysis Services and Power BI
Reading Time: 4 minutes Object-level security is one of the significant new features introduced for SQL Server Analysis Services 2017 and Azure Analysis Services. With object-level security, you have row-level security and add the ability to lock down tables and…
Read More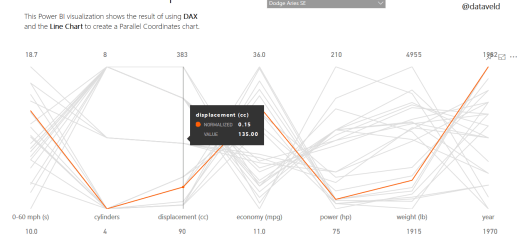
Using DAX to Normalize Data in Power BI
Reading Time: 2 minutes A challenge to which I infrequently return is attempting to create various “new” chart types using only Power BI’s native visuals. For example, I have tried to replicate a Horizon chart and Slopegraph in Power BI…
Read More
Throwing a Curve at the Power BI Line Chart
Reading Time: 6 minutes Last month, I explored how to take a Power BI area chart and make it into a unique “new” chart type using only data and DAX formulas. The line chart is also a candidate for a…
Read More