
Back in July 2017, I experimented with interactive R HTML custom visuals in Power BI and created a simple table visual that I called R DataTable. I had originally submitted it to AppSource in October. After a few rounds of suggested changes over about four months, it is now live! That sounds like a lot of time, but most of the delay was me taking long breaks from it. Also, many thanks to Boris Efraty from Microsoft for reviewing a high CPU issue with interactive R visuals. He also fixed a package dependency and ultimately helped to get this published. In case you did not know, Boris has developed many of the existing Power BI R HTML visuals that you can find on AppSource.

What is R DataTable, and what can it do? The short video below (no audio) provides a quick look at three of R DataTable’s key uses: column-specific filters, changing the number of records that display per page, and global search across all fields.
Functionality
- Search
- Global search field to filter data across all columns

- Global search field to filter data across all columns
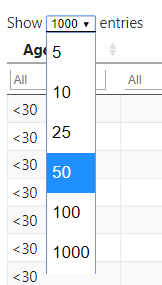
- Pagination
- Use “Show # of entries” to choose between 5, 10, 25, 50, 100, or 1000 records to display per page

- Use “Show # of entries” to choose between 5, 10, 25, 50, 100, or 1000 records to display per page
- Column-level filters
- Conveniently filter column values using the option below each column header


- Conveniently filter column values using the option below each column header


In my opinion, it is much easier to create a Power BI R custom visual than a standard TypeScript custom visual. This is particularly true if you limit or omit Format options. The best part of this visual is that it is only about a dozen lines of R code. R has a package called DT, which wraps JavaScript’s DataTables library. R already has a package called data.table, which is not at all related. In hindsight, I should have picked a different name for this Power BI visual to avoid confusion. R DataTable for Power BI uses JavaScript’s DataTables library via R’s DT package.
Please log any issues in the GitHub repository here: https://github.com/deldersveld/rDataTable
This is a fantastic visual for detailed analytical work. Thank you!
I’ve been using PowerBI to consolidate and prepare a huge disparate set of data for a migration into SAP and it has worked extremely well. The greatest benefit being creating all the transformations with snapshot data and then being able to apply all the work to more recent data extracts.
So I’ve not been using visuals at all really – just the Query Editor and punting the data into a table with slicers and exporting out again! R Data Table is just what I need.
However, I think I’ve overdone it though as my first table has 38 cols and 2795 rows and the filters are struggling…If I mouse along to a column on the right hand side of the table and click in a filter – the filter section jumps back to the left side. Is it processing limitations I wonder?
I will report the issue on GitHub once I remember my password 🙂
Hi,
I downloaded RDataTable-1.1.0.4.pbiviz and I cannot see dropdown list in the columns filters. I can just write some value in filter but I don’t have there the list of available values. How to change it?