
Reading Time: 4 minutes In Tableau, INCLUDE level of detail (LOD) expressions are used to obtain values for dimensions that are not directly used in a visualization. This final LOD post focuses on adapting Tableau INCLUDE LOD expressions to DAX…
Read MoreYear: 2018

Register for March 15 Webinar on Power BI Maps
Reading Time: < 1 minute Click on the image below to register for BlueGranite’s free webinar on Exploring Maps in Power BI. The webinar will be March 15th from 11am to Noon Eastern time. I will walk through a variety of…
Read More
Tableau to Power BI: EXCLUDE Level of Detail Expressions
Reading Time: 4 minutes In a recent post on Tableau level of detail (LOD) expressions, I explored a method to translate FIXED to DAX in Power BI. Continuing that theme, I’ll now attempt to show an equivalent for the EXCLUDE…
Read More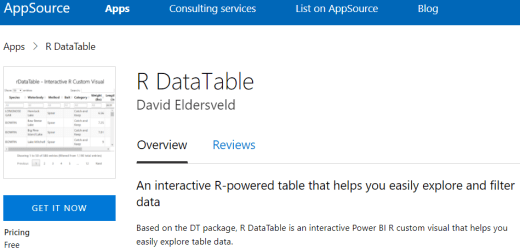
Introducing “R DataTable” Custom Visual for Power BI
Reading Time: 3 minutes Back in July 2017, I experimented with interactive R HTML custom visuals in Power BI and created a simple table visual that I called R DataTable. I had originally submitted it to AppSource in October. After…
Read More
Tableau to Power BI: FIXED LOD Expressions
Reading Time: 3 minutes Every once in awhile, I encounter questions from a trainee or client who is familiar with Tableau but who is getting started with Power BI. They have the ability to do X in Tableau and want…
Read More