
Reading Time: 6 minutes Update March 19, 2018: There are now many more than 10 ways to create maps in Power BI. Get the free Exploring Maps in Microsoft Power BI whitepaper from BlueGranite, and view the companion webinar: Whitepaper: https://www.blue-granite.com/maps-power-bi-whitepaper Webinar: https://www.blue-granite.com/maps-in-power-bi-mar-2018 Original…
Read MoreCategory: Maps
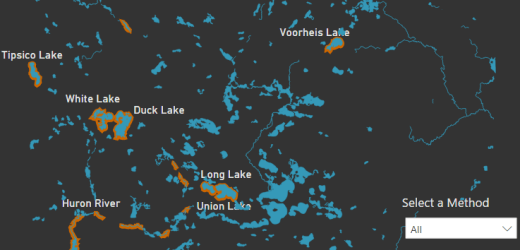
Putting the Shape Map into Focus
Reading Time: 3 minutes Here is a simple technique for the Shape Map in Power BI that allows additional focus on relevant polygons as well as adds some enhanced appeal.
Read More
A Glimpse into Michigan’s Children in Poverty
Reading Time: < 1 minute I created this report after seeing a list of local youth service organizations published by the Detroit Free Press. It features simple visualizations based on US Census data from 2015. One unique feature is a Shape Map…
Read More
Makeover Monday Week 8: Exploring the EU Potato Sector
Reading Time: < 1 minute Originally created as a Makeover Monday Week 8 submission, this Power BI report looks at the contributions for different European Union member states to potato production. Page 1 focuses on how only five countries combine…
Read More
Adding an HTML Tooltip in ArcGIS Maps for Power BI
Reading Time: 3 minutes With the preview launch of ArcGIS Maps for Power BI, one unexpected improvement is the ability to enhance tooltips. Whether you would like to add an image, formatted text, a table, or a list; you have…
Read More