Reading Time: < 1 minute Humbled and honored, I received an email from Microsoft late yesterday stating that I was awarded a 2017-2018 MVP for contributions to the Data Platform! Thank you to everyone who reads this blog, follows me on…
Read MoreTag: Microsoft
10 Ways to Create Maps in Microsoft Power BI
Reading Time: 6 minutes Update March 19, 2018: There are now many more than 10 ways to create maps in Power BI. Get the free Exploring Maps in Microsoft Power BI whitepaper from BlueGranite, and view the companion webinar: Whitepaper: https://www.blue-granite.com/maps-power-bi-whitepaper Webinar: https://www.blue-granite.com/maps-in-power-bi-mar-2018 Original…
Read More8 Things I’ve Learned about R Tools for Visual Studio 1.0
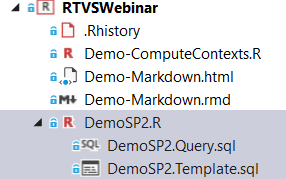
Reading Time: 4 minutes Today I presented a webinar for BlueGranite called Exploring R Tools for Visual Studio. It provides a glimpse into some of the benefits of RTVS, considers when you may want to use RTVS versus RStudio (or use…
Read MoreCreating Slopegraphs in Power BI
Reading Time: < 1 minute Did you know that it’s easy to transform Power BI’s Line Chart into a Slopegraph? No DAX or fancy workarounds are required. Slopegraphs are a great way to judge the rate and magnitude of change by…
Read MoreThrowing a Curve at the Power BI Line Chart
Reading Time: 6 minutes Last month, I explored how to take a Power BI area chart and make it into a unique “new” chart type using only data and DAX formulas. The line chart is also a candidate for a…
Read More


