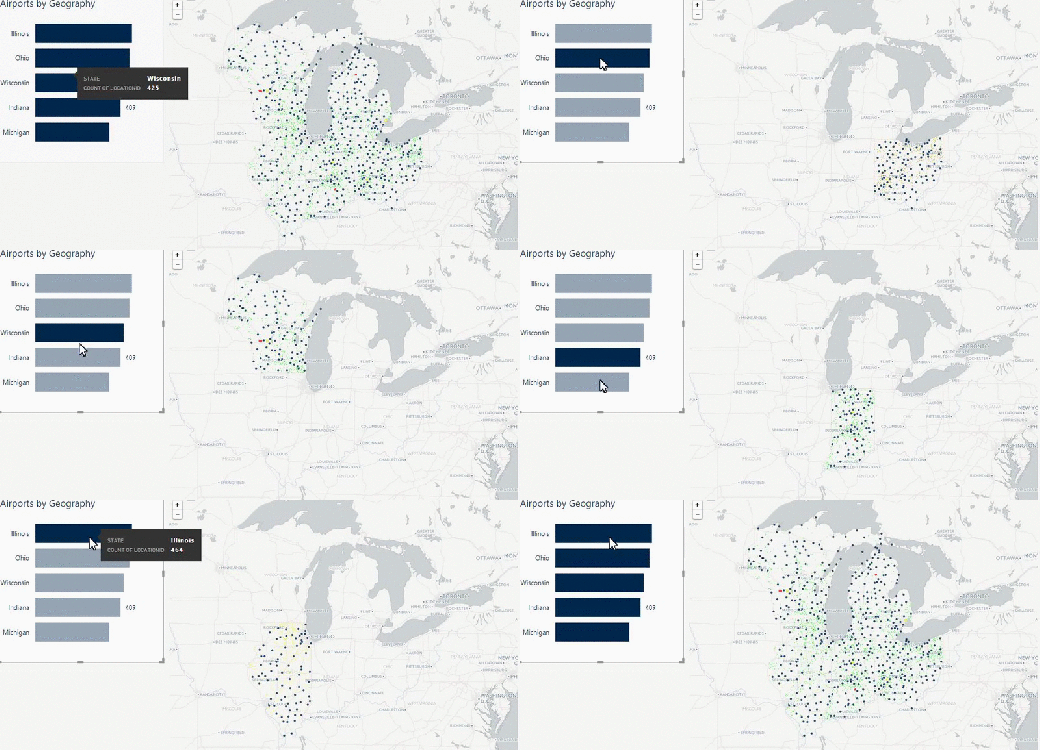
Reading Time: 2 minutes One of the benefits of working on a team at BlueGranite is the collective expertise that I can tap into when needed. Whether it’s a skill that I am learning or a problem that I am stumped…
Read MoreTag: Microsoft
5 Ways to Create Maps in Microsoft Power BI
Reading Time: 5 minutes UPDATED June 3, 2017: There have been a year’s worth of updates to Power BI since this “5 Ways” post was originally published. Please see the updated “10 Ways to Create Maps in Microsoft Power BI”…
Read MoreEmbed a Live Microsoft Power BI Report in Jupyter
Reading Time: < 1 minute Here’s a quick snippet showing how to host a live Power BI report in a Jupyter notebook using Power BI’s”Publish to Web” feature. Jupyter manages inline HTML fairly well when you are using Markdown, but it fails…
Read MoreR Visuals or Custom Visuals in Microsoft Power BI?
Reading Time: 5 minutes Over the past few years, there has been a movement in R to create packages that bind to JavaScript libraries to make R more interactive. Notably, htmlwidgets and rCharts are two examples that come to mind. In an…
Read MoreR Maps in Microsoft Power BI: Small Multiples
Reading Time: 5 minutes After an initial introduction to R maps in Power BI, let’s explore another topic: small multiples. This technique is used to make comparisons by showing variations of the same map plotted together in a grid. It is not limited to…
Read More


