
Reading Time: 2 minutes Anyone who remembers the original Power BI Custom Visual Gallery may recall seeing a visual called the Hexbin Scatterplot. It was the first visual that I created after Microsoft enabled custom visual development. When Microsoft deprecated the…
Read MoreTag: Power BI

Firefly Cartography in Power BI
Reading Time: < 1 minute A few days ago, John Nelson (b/t) posted an article on the ArcGIS Blog entitled Steal This Firefly Style Please. In the post, he shares his Firefly style for ArcGIS. Inspired by that post, I attempted…
Read More
Tableau to Power BI: INCLUDE Level of Detail Expressions
Reading Time: 4 minutes In Tableau, INCLUDE level of detail (LOD) expressions are used to obtain values for dimensions that are not directly used in a visualization. This final LOD post focuses on adapting Tableau INCLUDE LOD expressions to DAX…
Read More
Register for March 15 Webinar on Power BI Maps
Reading Time: < 1 minute Click on the image below to register for BlueGranite’s free webinar on Exploring Maps in Power BI. The webinar will be March 15th from 11am to Noon Eastern time. I will walk through a variety of…
Read More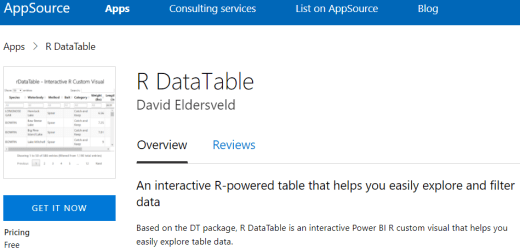
Introducing “R DataTable” Custom Visual for Power BI
Reading Time: 3 minutes Back in July 2017, I experimented with interactive R HTML custom visuals in Power BI and created a simple table visual that I called R DataTable. I had originally submitted it to AppSource in October. After…
Read More